| Allele | jimbee | ||||||||||||||||||||||||||||||||||||||||||||||||||||||||||||||||||||||||||||||||||||||||||||||||||||||||||||||||||||||||||||||||||||||||||||||||||||||||||||||||||||||||||||||||||||||||||||||||||||||||||||||||||
|---|---|---|---|---|---|---|---|---|---|---|---|---|---|---|---|---|---|---|---|---|---|---|---|---|---|---|---|---|---|---|---|---|---|---|---|---|---|---|---|---|---|---|---|---|---|---|---|---|---|---|---|---|---|---|---|---|---|---|---|---|---|---|---|---|---|---|---|---|---|---|---|---|---|---|---|---|---|---|---|---|---|---|---|---|---|---|---|---|---|---|---|---|---|---|---|---|---|---|---|---|---|---|---|---|---|---|---|---|---|---|---|---|---|---|---|---|---|---|---|---|---|---|---|---|---|---|---|---|---|---|---|---|---|---|---|---|---|---|---|---|---|---|---|---|---|---|---|---|---|---|---|---|---|---|---|---|---|---|---|---|---|---|---|---|---|---|---|---|---|---|---|---|---|---|---|---|---|---|---|---|---|---|---|---|---|---|---|---|---|---|---|---|---|---|---|---|---|---|---|---|---|---|---|---|---|---|---|---|---|---|---|
| Mutation Type | large deletion | ||||||||||||||||||||||||||||||||||||||||||||||||||||||||||||||||||||||||||||||||||||||||||||||||||||||||||||||||||||||||||||||||||||||||||||||||||||||||||||||||||||||||||||||||||||||||||||||||||||||||||||||||||
| Chromosome | 7 | ||||||||||||||||||||||||||||||||||||||||||||||||||||||||||||||||||||||||||||||||||||||||||||||||||||||||||||||||||||||||||||||||||||||||||||||||||||||||||||||||||||||||||||||||||||||||||||||||||||||||||||||||||
| Coordinate | |||||||||||||||||||||||||||||||||||||||||||||||||||||||||||||||||||||||||||||||||||||||||||||||||||||||||||||||||||||||||||||||||||||||||||||||||||||||||||||||||||||||||||||||||||||||||||||||||||||||||||||||||||
| Base Change | |||||||||||||||||||||||||||||||||||||||||||||||||||||||||||||||||||||||||||||||||||||||||||||||||||||||||||||||||||||||||||||||||||||||||||||||||||||||||||||||||||||||||||||||||||||||||||||||||||||||||||||||||||
| Gene | Slc5a2 | ||||||||||||||||||||||||||||||||||||||||||||||||||||||||||||||||||||||||||||||||||||||||||||||||||||||||||||||||||||||||||||||||||||||||||||||||||||||||||||||||||||||||||||||||||||||||||||||||||||||||||||||||||
| Gene Name | solute carrier family 5 (sodium/glucose cotransporter), member 2 | ||||||||||||||||||||||||||||||||||||||||||||||||||||||||||||||||||||||||||||||||||||||||||||||||||||||||||||||||||||||||||||||||||||||||||||||||||||||||||||||||||||||||||||||||||||||||||||||||||||||||||||||||||
| Synonym(s) | Sglt2 | ||||||||||||||||||||||||||||||||||||||||||||||||||||||||||||||||||||||||||||||||||||||||||||||||||||||||||||||||||||||||||||||||||||||||||||||||||||||||||||||||||||||||||||||||||||||||||||||||||||||||||||||||||
| Chromosomal Location | 127,864,855-127,871,602 bp (+) (GRCm39) | ||||||||||||||||||||||||||||||||||||||||||||||||||||||||||||||||||||||||||||||||||||||||||||||||||||||||||||||||||||||||||||||||||||||||||||||||||||||||||||||||||||||||||||||||||||||||||||||||||||||||||||||||||
| MGI Phenotype |
FUNCTION: [Summary is not available for the mouse gene. This summary is for the human ortholog.] This gene encodes a member of the sodium glucose cotransporter family which are sodium-dependent glucose transport proteins. The encoded protein is the major cotransporter involved in glucose reabsorption in the kidney. Mutations in this gene are associated with renal glucosuria. Two transcript variants, one protein-coding and one not, have been found for this gene. [provided by RefSeq, Feb 2015] PHENOTYPE: Mice homozygous for a null allele exhibit increased urine glucose, increased eating and drinking behaviors, increased circulating renin activity, decreased urine osmolality, decreased serum aldosterone levels, polyuria, and decreased glucose renal reabsorption. [provided by MGI curators] |
||||||||||||||||||||||||||||||||||||||||||||||||||||||||||||||||||||||||||||||||||||||||||||||||||||||||||||||||||||||||||||||||||||||||||||||||||||||||||||||||||||||||||||||||||||||||||||||||||||||||||||||||||
| Accession Number | Ncbi RefSeq: NM_133254.3; MGI: 2181411 | ||||||||||||||||||||||||||||||||||||||||||||||||||||||||||||||||||||||||||||||||||||||||||||||||||||||||||||||||||||||||||||||||||||||||||||||||||||||||||||||||||||||||||||||||||||||||||||||||||||||||||||||||||
| Mapped | Yes | ||||||||||||||||||||||||||||||||||||||||||||||||||||||||||||||||||||||||||||||||||||||||||||||||||||||||||||||||||||||||||||||||||||||||||||||||||||||||||||||||||||||||||||||||||||||||||||||||||||||||||||||||||
| Amino Acid Change | |||||||||||||||||||||||||||||||||||||||||||||||||||||||||||||||||||||||||||||||||||||||||||||||||||||||||||||||||||||||||||||||||||||||||||||||||||||||||||||||||||||||||||||||||||||||||||||||||||||||||||||||||||
| Institutional Source | Beutler Lab | ||||||||||||||||||||||||||||||||||||||||||||||||||||||||||||||||||||||||||||||||||||||||||||||||||||||||||||||||||||||||||||||||||||||||||||||||||||||||||||||||||||||||||||||||||||||||||||||||||||||||||||||||||
| Ref Sequences |
Ensembl: ENSMUST00000118169
(fasta)
|
||||||||||||||||||||||||||||||||||||||||||||||||||||||||||||||||||||||||||||||||||||||||||||||||||||||||||||||||||||||||||||||||||||||||||||||||||||||||||||||||||||||||||||||||||||||||||||||||||||||||||||||||||
| Gene Model | not available | ||||||||||||||||||||||||||||||||||||||||||||||||||||||||||||||||||||||||||||||||||||||||||||||||||||||||||||||||||||||||||||||||||||||||||||||||||||||||||||||||||||||||||||||||||||||||||||||||||||||||||||||||||
| AlphaFold | Q923I7 | ||||||||||||||||||||||||||||||||||||||||||||||||||||||||||||||||||||||||||||||||||||||||||||||||||||||||||||||||||||||||||||||||||||||||||||||||||||||||||||||||||||||||||||||||||||||||||||||||||||||||||||||||||
| SMART Domains |
|
||||||||||||||||||||||||||||||||||||||||||||||||||||||||||||||||||||||||||||||||||||||||||||||||||||||||||||||||||||||||||||||||||||||||||||||||||||||||||||||||||||||||||||||||||||||||||||||||||||||||||||||||||
| Meta Mutation Damage Score | Not available  |
||||||||||||||||||||||||||||||||||||||||||||||||||||||||||||||||||||||||||||||||||||||||||||||||||||||||||||||||||||||||||||||||||||||||||||||||||||||||||||||||||||||||||||||||||||||||||||||||||||||||||||||||||
| Is this an essential gene? | Non Essential (E-score: 0.000) |
||||||||||||||||||||||||||||||||||||||||||||||||||||||||||||||||||||||||||||||||||||||||||||||||||||||||||||||||||||||||||||||||||||||||||||||||||||||||||||||||||||||||||||||||||||||||||||||||||||||||||||||||||
| Phenotypic Category | Autosomal Recessive | ||||||||||||||||||||||||||||||||||||||||||||||||||||||||||||||||||||||||||||||||||||||||||||||||||||||||||||||||||||||||||||||||||||||||||||||||||||||||||||||||||||||||||||||||||||||||||||||||||||||||||||||||||
| Candidate Explorer Status | loading ... | ||||||||||||||||||||||||||||||||||||||||||||||||||||||||||||||||||||||||||||||||||||||||||||||||||||||||||||||||||||||||||||||||||||||||||||||||||||||||||||||||||||||||||||||||||||||||||||||||||||||||||||||||||
| Single pedigree Linkage Analysis Data |
|
||||||||||||||||||||||||||||||||||||||||||||||||||||||||||||||||||||||||||||||||||||||||||||||||||||||||||||||||||||||||||||||||||||||||||||||||||||||||||||||||||||||||||||||||||||||||||||||||||||||||||||||||||
| Penetrance | |||||||||||||||||||||||||||||||||||||||||||||||||||||||||||||||||||||||||||||||||||||||||||||||||||||||||||||||||||||||||||||||||||||||||||||||||||||||||||||||||||||||||||||||||||||||||||||||||||||||||||||||||||
| Alleles Listed at MGI | |||||||||||||||||||||||||||||||||||||||||||||||||||||||||||||||||||||||||||||||||||||||||||||||||||||||||||||||||||||||||||||||||||||||||||||||||||||||||||||||||||||||||||||||||||||||||||||||||||||||||||||||||||
| Lab Alleles |
|
||||||||||||||||||||||||||||||||||||||||||||||||||||||||||||||||||||||||||||||||||||||||||||||||||||||||||||||||||||||||||||||||||||||||||||||||||||||||||||||||||||||||||||||||||||||||||||||||||||||||||||||||||
| Mode of Inheritance | Autosomal Recessive | ||||||||||||||||||||||||||||||||||||||||||||||||||||||||||||||||||||||||||||||||||||||||||||||||||||||||||||||||||||||||||||||||||||||||||||||||||||||||||||||||||||||||||||||||||||||||||||||||||||||||||||||||||
| Local Stock | Live Mice, Sperm, gDNA | ||||||||||||||||||||||||||||||||||||||||||||||||||||||||||||||||||||||||||||||||||||||||||||||||||||||||||||||||||||||||||||||||||||||||||||||||||||||||||||||||||||||||||||||||||||||||||||||||||||||||||||||||||
| MMRRC Submission | 036517-MU | ||||||||||||||||||||||||||||||||||||||||||||||||||||||||||||||||||||||||||||||||||||||||||||||||||||||||||||||||||||||||||||||||||||||||||||||||||||||||||||||||||||||||||||||||||||||||||||||||||||||||||||||||||
| Last Updated | 2018-03-09 6:32 PM by Diantha La Vine | ||||||||||||||||||||||||||||||||||||||||||||||||||||||||||||||||||||||||||||||||||||||||||||||||||||||||||||||||||||||||||||||||||||||||||||||||||||||||||||||||||||||||||||||||||||||||||||||||||||||||||||||||||
| Record Created | 2010-08-01 8:31 PM by Wataru Tomisato | ||||||||||||||||||||||||||||||||||||||||||||||||||||||||||||||||||||||||||||||||||||||||||||||||||||||||||||||||||||||||||||||||||||||||||||||||||||||||||||||||||||||||||||||||||||||||||||||||||||||||||||||||||
| Record Posted | 2012-11-01 | ||||||||||||||||||||||||||||||||||||||||||||||||||||||||||||||||||||||||||||||||||||||||||||||||||||||||||||||||||||||||||||||||||||||||||||||||||||||||||||||||||||||||||||||||||||||||||||||||||||||||||||||||||
| Phenotypic Description |
The jimbee phenotype was identified among ENU-mutagenized G3 mice in a screen for mutants with susceptibility to dextran sulfate sodium (DSS)-induced colitis. The screen uses weight-loss as an indication of colitis. The jimbee mouse was susceptible to low doses of DSS (1%) and showed bleeding, diarrhea and severe weight loss (Figure 1). Monitoring of water intake determined that the jimbee mice drank more water than their wild-type cohorts (Figure 2). To determine if an increased intake of the DSS-treated water was leading to the jimbee phenotype, wild-type and jimbee mice were gavaged with DSS-treated water. When gavaged with DSS, the jimbee mice did not show a significant susceptiblilty to DSS-induced colitis (Figure 3). Subsequent urinalysis of the jimbee mice demonstrated reduced concentrations of urea nitrogen, suggesting dilution of the urine, and elevated urine glucose levels compared to the wild-type cohorts (Figure 4). |
||||||||||||||||||||||||||||||||||||||||||||||||||||||||||||||||||||||||||||||||||||||||||||||||||||||||||||||||||||||||||||||||||||||||||||||||||||||||||||||||||||||||||||||||||||||||||||||||||||||||||||||||||
| Nature of Mutation |
The jimbee mutation was mapped using bulk segregation analysis (BSA) of F2 intercross offspring using C57BL/10J as the mapping strain. The mutation showed strongest linkage to the marker at position 104565567 bp on Chromosome 7 (synthetic LOD=6.02; Figure 5). Based on an increased intake of water by jimbee mice compared to wild type mice, a mutation in Slc5a2 was suspected (1-3). Capillary sequencing identified a 19 bp deletion (bp 4913-4931) within exon 10 (of 14 total exons) of the Slc5a2 gene in Genbank genomic region NC_000073 for linear genomic DNA sequence of Slc5a2 (Figure 6). This corresponds to bp 128270589 - 128270608 on Chromosome 7. The deletion is predicted to result in a frameshift and subsequent coding of a premature stop within exon 10. Expression of Slc5a2 mRNA in jimbee kidneys is extremely low; SGLT2 protein expression has not been examined. | ||||||||||||||||||||||||||||||||||||||||||||||||||||||||||||||||||||||||||||||||||||||||||||||||||||||||||||||||||||||||||||||||||||||||||||||||||||||||||||||||||||||||||||||||||||||||||||||||||||||||||||||||||
| Illustration of Mutations in Gene & Protein |
|||||||||||||||||||||||||||||||||||||||||||||||||||||||||||||||||||||||||||||||||||||||||||||||||||||||||||||||||||||||||||||||||||||||||||||||||||||||||||||||||||||||||||||||||||||||||||||||||||||||||||||||||||
| Protein Prediction |
The Slc5a2 (alternatively, Sglt2) gene encodes the 670 amino acid SGLT2 protein, a member of the solute carrier family V transporter family (SLC5; alternatively, sodium (Na+) substrate symporter gene family (SSSF)) [(4;5); reviewed in (6)]. SGLT2 is highly conserved and mouse and human SGLT2 are 90% identical (7). Human SGLT2 shares a similar topology and 59% amino acid sequence identity with SGLT1, another SLC5 family member that is expressed in the kidney (other SLC5 family members are less studied and are shown in Table 1, below) (5;8). SGLT2 and SGLT1 both have 14 transmembrane-spanning domains and the N- and C-termini are extracellular, although most of the C-terminus comprises transmembrane domain 14 [Figure 7; (9;10); reviewed in (6;11-13)]. Several studies propose that transmembrane domains 10 through 13 in the SGLT proteins are essential to bind and translocate the sugar substrate [(8;9;14;15); reviewed in (6)]. Mutations within these domains lead to cases of extreme glucosuria (alternatively, glycosuria; i.e., glucose excretion in the urine) (8). The necessity of transmembrane 14 in sugar binding is debatable as some members of the SLC5 family do not have this domain (i.e., NIS and AIT) and deletion of this domain in experiments with a truncated SGLT1 did not eliminate sugar transport (15). SGLT2 mutations within transmembrane domains two, three, four, and eight can also cause glucosuria, indicating that these domains are functionally significant, although this has not been further studied (6;8;16). SGLT2 shares two motifs with other members of the SLC5 family. Within the fifth transmembrane domain is an SSSF consensus sequence [GS]-2(2)-[LIY]-x(3)-[LIVMFYWSTAG](7)-x(3)-[LIY]- [STAV]-x(2)-G-G-[LMF]-x-[SAP] (12;17). The second motif, a SGLT/SMIT consensus sequence [R-xT-x-x-x-x-F-L-A-G-x-x-x-x-W-W-x-x-G-A-S-], is near the N-terminus (17). Mouse SGLT2 is N-glycosylated at Asn 248 between transmembrane domains six and seven (15), however, the functional significance of this post-translational modification has not been studied. N-linked glycosylation of the SLC5 family members SGLT1 and NIS is not required for protein activity (13).
The crystal structure of an SLC5 Na+-galactose symporter (vSGLT) from Vibrio parahaemolyticus has been solved in the presence of Na+ and galactose [Figure 8; PDB: 3DH4; (10); reviewed in (12)]. vSGLT shares 32% sequence identity (60% similarity) with SGLT1 (10). Similar to SGLT1 and SGLT2 (9), vSGLT has 14 transmembrane domains and extracellular N- and C-termini (10). The crystallized protein assembled as a dimer (10). However, the significance of dimer formation is unknown as studies have shown by freeze-fracture electron microscopy that SGLTs function as monomers (18;19). The core of vSGLT is inverted repeats of five transmembrane domains (two through six and seven through eleven) [(10); reviewed in (12)]. Transmembrane domains two through four, seven through nine, and eleven are involved in side-chain interactions for ligand selectivity (in the case of vSGLT, galactose) via specific side-chain interactions in transmembrane two, three, seven, eight, and eleven [(10) ; reviewed in (12)]. The intracellular exit pathway is a large hydrophilic cavity blocked by Tyr263 in transmembrane domain seven (10). At the intersection of transmembrane domain two and nine is a plausible Na+-binding site, approximately 10Å from the substrate-binding site [(10); reviewed in (12)]. Upon Na+ binding on the external face of the protein, transmembrane domain two rearranges to form the substrate-binding site (12). Binding of galactose causes the intracellular cavity to enlarge via conformational changes in transmembrane domains three, four, and seven through eleven (12). Displacement of Tyr263 releases the Na+ and the galactose intracellularly [(10); reviewed in (12)]. The jimbee mutation is a deletion of codons that would normally encode aa 405-410 of the SLGT2 protein. Residues 405-410 comprise part of the extracellular loop between transmembrane domains nine and ten (Ensembl). The jimbee mutation is predicted to result in a frameshift that would result in the coding of 11 aberrant amino acids after aa 404, followed by a premature stop codon after aa 415 resulting in the loss of residues normally within transmembrane domains 10 through 14. Due to the slight expression of Slc5a2, nonsense-mediated decay of the truncated mRNA is predicted to occur. | ||||||||||||||||||||||||||||||||||||||||||||||||||||||||||||||||||||||||||||||||||||||||||||||||||||||||||||||||||||||||||||||||||||||||||||||||||||||||||||||||||||||||||||||||||||||||||||||||||||||||||||||||||
| Expression/Localization | SGLT2 is expressed in the brush border membrane of the S1 (predominantly) and S2 segments of the early proximal convoluted tubule in the renal cortex of the kidney; SGLT2 was not detected in the S3 segments (3;5;12-15;20-26). In rats, immunohistochemistry with an SGLT2-specific antibody stained the brush border of the S1 and S2 segments of the proximal tubules; the brush border of the small intestine (where SGLT1 is predominantly active, see "Background", below) was not immunoreactive (22). Further immunohistochemical analysis showed specific staining of the apical brush border in the early proximal convoluted tubules; no signal was observed in the late proximal convoluted tubules, straight proximal tubules, or downstream segments of the nephron and collecting duct (22). Western blot analysis of total cell membrane and brush membranes isolated from the kidney cortex labeled a 75-kDa SGLT2-specific band; total cell membrane from the small intestinal mucosa was not immunoreactive (22). In the mouse, Sglt2 is almost exclusively expressed in the kidney; Sglt2 mRNA was not detected in mouse extrarenal organs (22). In cattle, low concentrations of Sglt2 were also detected in the small intestine, liver, lung, spleen, mammary gland, ciliary epithelium, and skeletal muscle [(7;27;28); reviewed in (11;12;22)]. RT-PCR of mRNA from human tissues determined that SGLT2 expression is ubiquitous, with highest expression in the kidneys; lower, but significant, expression was detected in the small intestine, liver, brain, prostate, and testis (29). Regulation of SGLT2 expression Challenges to the immune system Acute renal failure with renal tubular dysfunction and glucosuria occur in instances of severe sepsis, therefore, Schmidt et al. (2007) examined the regulation of Sglt2 during severe experimental inflammation (24). Treatment with lipopolysaccharide (LPS) decreased the expression of Sglt2 by as much as 67% in the kidney (24). In addition, exposure to TNF-α, IL-1β, IFN-γ, or IL-6 downregulated Sglt2 expression (24). Treatment of animals with LPS plus dexamethasone, a corticoid that is used to reduce inflammation, led to increased Sglt2 expression when compared to the animals treated with LPS alone (24). Schmidt et al. concluded that cytokines could mediate LPS-induced regulation of Sglt2 (24). Hepatocyte nuclear factor 1α (HNF1α) The regulation of SGLT1 expression by the transcription factors HNF-1α and HNF-1β has been documented [(30); reviewed in (11)]. Further studies determined that while heterodimers of HNF-1α/β can decrease SGLT1 transcription, homodimers of HNF-1α can increase transcription [(31); reviewed in (11)]. Furthermore, in HNF-1α-deficient mice, renal tubular glucose reabsorption was impaired, indicating that HNF-1α also regulates Sglt2 expression [(32); reviewed in (11)]. Further studies revealed that there is a decrease in Sglt2 expression in the renal tubular cells of HNF-1α-deficient mice (33). Pontoglio et al. (1996) showed that HNF-1α directly controls Sglt2 expression in both mice and humans by binding to HNF-1α-specific sites in the Sglt2 promoter [(34;35); reviewed in (11)]. In diabetes, SGLT2 is overexpressed (discussed in "Background", below) via HNF-1α-mediated regulation (35). Plasma glucose levels are a major regulator of the HNF-1α-mediated regulation of Sglt2 expression (11;12;25) and treatment with insulin decreases Sglt2 mRNA levels in a diabetic rat model (35). Androgens Studies have shown that SGLT1 and SLGT2 are regulated by androgens [i.e., male sex hormones] (22;36). Immunostaining of SGLT2 in the brush border in the cortical proximal tubules in both male and female rats determined that the expression level in males was significantly weaker than in the females (22). Furthermore, examination by Western blot analysis found that the density of the SGLT2-specific protein band from female kidney extracts was increased approximately threefold. Although there were stark differences in the protein levels, the mRNA levels between the male and female rats were similar (22). Immunohistochemistry of the brush border in pre-pubertal males and females found that the levels of SGLT2 were similar and that both were lower than in adult males or females (22). Taken together, these results indicate that sex-related differences in the renal expression of SGLT2 in rats occur after puberty (22). In castrated animals, staining of SGLT2 in the brush border was increased; testosterone treatment reversed this increase (22). In addition, treatment with estrogen increased the staining of SGLT2 (22). In contrast to the sex-related changes of SGLT2 expression observed in the kidney of the rat, the sex differences in mouse were opposite: the staining intensity was stronger in males than females (22). The differences observed in the regulation of SGLT2 between rat and mouse indicates that androgens have a species-specific effect on the regulation of renal SGLT2 expression. Sodium intake High sodium increases the expression of Sglt2, Glut2, and Glut1 in the renal proximal tubules [(37); reviewed in (11)]. Sglt1 is also increased in the rat small intestine upon an increase in salt intake (11). Also, dietary carbohydrate can alter the expression of SGLT1 mRNA and protein [(38;39); reviewed in (11)]; regulation of Sglt2 by dietary carbohydate levels has not been studied. Angiotensin II (ANG II) activity in renovascular hypertension In normal animals, increases in arterial pressure lead to a natriuretic (i.e., promoting the excretion of Na+) and diuretic (i.e., promoting the excretion of water) response associated with decreased Na+ reabsorption in the proximal tubule [(40); reviewed in (41)]. In contrast, the natriuresis and diuresis is reduced in hypertensive animals. In the renal cortex of hypertensive rats, glucose uptake is increased in brush border membrane vesicles (BBMV) along with a concomitant increase in the expression of SGLT2 mRNA and protein (41). Bautista et al. (2004) provide evidence that increased ANG II activity leads to increased SGLT2 expression and activity under hypertensive conditions (41). ANG II is a hormone that alters renal blood flow, renin release, and vasoconstrictor effects thereby contributing to hypertension (42). Indeed, inhibition of ANG II synthesis or blockade of the ANG II type 1 receptor using two commercially available drugs (ramipril or losartan) that prevent increases in blood pressure, blocked the increase in SGLT2 expression and activity (41). | ||||||||||||||||||||||||||||||||||||||||||||||||||||||||||||||||||||||||||||||||||||||||||||||||||||||||||||||||||||||||||||||||||||||||||||||||||||||||||||||||||||||||||||||||||||||||||||||||||||||||||||||||||
| Background |
Glucose is an essential energy source for the brain, muscle, and other organs (12). As membranes are impermeable to glucose, glucose transporters are required to distribute glucose through the cell membranes to various tissues (12). In the kidney, two classes of glucose transporters, SGLTs and GLUTs, are required for transepithelial glucose transport (11). In addition to their roles in glucose reabsorption, glucose transporters also facilitate the release of glucose from the liver upon conditions of low glucose levels (11). SGLTs in the S1 and S3 segments of the proximal tubule facilitate the transport of glucose from the lumen into the renal epithelial cellm (Figure 9). Glucose accumulation inside the cell establishes a gradient that promotes glucose transport via the GLUTs into the interstitium (1;11). The SGLT1 and SGLT2 proteins are Na+/glucose co-transporters and act via secondary active transport (11;12;25). Glucose transport is coupled to Na+ transport, which is powered by a Na+ electrochemical gradient [(43;44); reviewed in (1;6;24)]. The Na+ that enters the cell is then transported into the intersitium by the Na+-K+-ATPase at the basolateral membrane, thereby maintaining the electrochemical gradient needed for glucose transport (11;12). The GLUT family of glucose transporters mediates facilitative diffusion, in which molecules are transported across membranes along their concentration gradient (12). 90% of the ~180 grams of glucose filtered daily in the kidney is reabsorbed in the S1 segment of the proximal tubule via SGLT2 and GLUT2 on the luminal and basolateral membranes of epithelial cells, respectively (Figure 9; 1;6;11;25). The remaining (~10%) glucose that does not get reabsorbed in the S1 segment, can be reabsorbed in the S3 segment by SGLT1 and GLUT1 on the luminal and basolateral membranes, respectively (6;11;25). Glucose can also be absorbed by SGLT1 and GLUT2 within the duodenum and jejunum portions of the intestine (11). The SLC5 family The SGLT proteins are encoded by Slc5 genes (12). As of 2010, there were over 220 members in the SLC5 family; 12 are from the human genome (Table 1) [(12;13); reviewed in (45;46)]. The human SLC5 genes are expressed in many tissues including kidney, brain, muscle, small intestine, and the thyroid gland (13). The proteins share 21-70% amino acid identity with SGLT1, but are diverse in gene structure (13). Most have 13 or 14 transmembrane helices (see Protein Prediction) [(9); reviewed in (45;46)]. Table 1. The Slc5 family. Note: In the Renal location column, “Not determined” indicates that the protein is expressed in the kidney, but the exact location within the kidney has not been determined. “N/A” indicates that the protein is not expressed in the kidney. Adapted from: (12;13;47;48)
Although they transport different solutes (e.g., glucose, amino acids, vitamins, osmolytes, and some ions in the brush border of the small intestine and renal proximal tubules), the members of the SLC5 family are functionally similar: all of the proteins are Na+/substrate co-transporters and can co-transport water and urea [(9)(7); reviewed by (11;12;25;46)(9;10;23;45)]. SGLT2 in diabetes Under normal conditions, glucose entering the tubular system is reabsorbed so that urine contains a negligible amount of glucose. However, in diabetes, despite an increase in glucose transport, the amount of glucose that passes through the kidney exceeds the transport capacity for glucose, leading to glucosuria (49). In experimental animal models of diabetes as well as in cultured renal proximal tubular cells from the urine of type 2 diabetic patients, there is increased renal glucose transport due to an increase in both the expression and activity of SGLT2 and GLUT2 [(35;50); reviewed in (1;11)]. It has been proposed that the excess glucose transported by SGLT1/2 and GLUT1/2 leads to glucose toxicity observed in the diabetic kidney (49). Correction of hyperglycemia reversed the increase in SGLT2 expression [reviewed in (1)]. The increase in SGLT2 mRNA is concomitant with an increase in HNF-1α mRNA in diabetic rats (35). The search for diabetes treatments is ongoing. In patients with diabetes, SGLT2 levels are upregulated and renal glucose uptake is increased, leading to hyperglycemia (50). A method by which glucose reabsorption (and subsequent plasma glucose levels) would be suppressed without significant damage to the kidney would be promising. Recently, SGLT2 inhibitors have been examined as a possible treatment option. Treatment with SGLT2 inhibitors leads to dose-dependent glucosuria in normal mice, rats, and dogs, however, fasting plasma glucose concentrations are not significantly changed due to increases in hepatic glucose production (to compensate for the glucosuria) (51). These inhibitors prevent renal glucose uptake, promoting glucosuria. Antisense oligonucleotides that would downregulate SGLT2 are also being tested as possible treatment options [(52); reviewed in (53)]. SGLT2 mutations and renal glucosuria Mutations in SGLT2 (missense, nonsense, and splicing mutations as well as small deletions (both in-frame and frameshift)) can lead to familial renal glucosuria [FRG; OMIM: #233100; (6;8;12;16;35;45;46;54)]. FRG can be inherited in an autosomal recessive or autosomal dominant pattern (OMIM). FRG patients have normal fasting plasma glucose concentrations with persistent isolated glucosuria; their glucose tolerance tests are normal (46). In general, patients with FRG do not have severe clinical consequences (12). However, there are rare, more severe cases of FRG that can result in episodic dehydration and ketosis (55), an increase in urinary tract infections (56;57), and activation of the renin-angiotensin-aldosterone system, secondary to natriuresis [(45); reviewed in (12)]. In one instance, a nonsense homozygous mutation of SLC5A2 resulted in glucosoria and neurological deficits [(54); reviewed in (6)]. SGLT2 mouse models Jurczak et al. (2011) studied glucose homeostasis in an Sglt2 knockout mouse (Sglt2-/-). These mice displayed an approximate 4.5-fold increase in daily urine volume and an approximate 500-fold increase in glucosuria (1). Plasma chemistries of the mice were unchanged and the blood urea nitrogen/creatinine ratio was similar between the knockout and wild-type mice (1). The glomerular structures and tubulointerstitial compartments were normal when examined histologically (1). During the light cycle (i.e., resting hours) the mice did not exhibit differences in activity, energy expenditure, or food intake although water intake was elevated (1). During the dark cycle (i.e., active hours) the mice exhibited increases in activity and energy expenditure as well as increases in food and water intake (1). The knockout animals had lower body weights due to the increase in energy expenditure and the caloric loss of carbohydrate in the urine (1). Comparison of the knockout animals on a regular chow diet to those on a high fat diet found that the high fat diet fed animals had lower water consumption and urine output, consistent with lower carbohydrate intake and lower levels of glucosuria (1). Importantly, Jurczak et al. also found that Slc5a2 deletion in a genetic model of type 2 diabetes (db/db) led to improved glucose homeostasis and islet function (i.e., islet mass was preserved and insulin secretion was improved) (1). In another study, Vallon et al. (2011) studied Sglt2-/- mice to examine SGLT2-mediated glucose reabsorption (3). Similar to the findings of Jurczak et al., the animals exhibited glucosuria and polyuria as a result of disruption in glucose reabsorption in the kidney. This study also provided pivotal evidence for the localization of SLGT2 to the brush border membrane of the early proximal convoluted tubule (3). Ly et al. (2011) recently characterized an ENU-induced Sglt2 mutant mouse model (Sweet Pee; SP) (2). Sequence analysis determined that the SP mutation was an insertion of a thymine at position 433, in a portion of exon 4 encoding transmembrane helix 4; the insertion resulted in a frameshift and a premature stop codon. Characterization of the SP mice found that they exhibit glucosuria and they are euglycemic (2). Examination of mRNA levels of Glut1, Glut2, and Sglt1 found that the levels of these glucose transporters were normal. In addition, amplification of a region proximal to the mutation found that Sglt2 expression was elevated in SP relative to wild-type mice. Ly et al. propose that the increase in Sglt2 expression is due to the elevated tubular glucose levels (2). Similar to the jimbee mice, the SP mice had increased water intake and urine volume. In addition, the SP animals were examined for defects in the filtration of other micronutrients and it was found that the SP mice excreted an elevated amount of calcium, magnesium, phosphate, and potassium compared to wild-type animals; there were no significant changes in the excretion of urate or sodium. Decreased body weights relative to wild-type mice were documented for both heterozygous and homozygous SP animals 3 to 14 weeks of age; loss of carbohydrate and essential micronutrients in the urine are believed to contribute to reduced weight. The SP mice were also examined to determine the benefits of SGLT2 inhibition in lowering of blood glucose levels in mice with streptozotocin (STZ)-induced diabetes. The non-diabetic SP mice had better glucose tolerance, and loss of SGLT2 did not lead to hypoglycemia or damage to the kidneys (2). Although the diabetic mutant animals had better glycemic control relative to diabetic control animals, the mortality rate was higher in the diabetic SP mice (70% in diabetic mutants vs. 10% in diabetic wild-type mice at week 20 post-STZ induction) (2). The increase in mortality was proposed to be due to an increased risk of urosepsis. | ||||||||||||||||||||||||||||||||||||||||||||||||||||||||||||||||||||||||||||||||||||||||||||||||||||||||||||||||||||||||||||||||||||||||||||||||||||||||||||||||||||||||||||||||||||||||||||||||||||||||||||||||||
| Putative Mechanism | As shown in knockout mouse models of Slc5a2 (1-3), and in humans with mutations in SLC5A2 (6;8;12;16;35;45;46;54), SGLT2 is essential for the reabsorption of glucose in the kidney. Due to the failure in renal glucose reabsorption, Sglt2 mutant mice exhibit osmotic diuresis and excessive thirst (1-3). Although the jimbee mice were initially identified through a DSS-induced colitis screen, subsequent analysis determined that the colitis was caused by an increased consumption of the DSS-containing water. Urinalysis of the jimbee mice determined that the glucose content of the urine was significantly elevated compared to that of wild-type controls. | ||||||||||||||||||||||||||||||||||||||||||||||||||||||||||||||||||||||||||||||||||||||||||||||||||||||||||||||||||||||||||||||||||||||||||||||||||||||||||||||||||||||||||||||||||||||||||||||||||||||||||||||||||
| Primers | Primers cannot be located by automatic search. | ||||||||||||||||||||||||||||||||||||||||||||||||||||||||||||||||||||||||||||||||||||||||||||||||||||||||||||||||||||||||||||||||||||||||||||||||||||||||||||||||||||||||||||||||||||||||||||||||||||||||||||||||||
| Genotyping | Jimbee genotyping is performed by amplifying the region containing the mutation using PCR followed by sequencing of the amplified region to detect the nucleotide change. The following primers were used for PCR amplification: Primers for PCR amplification Slc5a2_(F): 5’-GGTGAAGCTCATGCCCAATG-3’ Slc5a2_(R): 5’- GTAATCGAAGAGCTGCCCAC-3’ Primers for sequencing Slc5a2_seq_(F): 5’-CACCAACCCTTCACCACCTT-3’ Slc5a2_seq_(R): 5’-GGACACCGCCACGATGAATA-3’ PCR program 1) 94°C 2:00 2) 94°C 0:30 3) 57°C 0:30 4) 72°C 1:00 5) repeat steps (2-4) 29x 6) 72°C 7:00 7) 4°C ∞ The following sequence of 256 nucleotides (from Genbank genomic region NC_000073 of the linear genomic sequence of Slc5a2) is amplified: 4672 ggtgaagct 4681 catgcccaat ggtgagtgag ggctggaaat ggattgccct tggccaagcc tgcagggact 4741 gcctgtggga gggtcacctc accaaccctt caccaccttg aacgcactga aggccttggc 4801 ctgacagctc ctgttggcca caggtctgcg cggactcatg ctggcagtca tgctggctgc 4861 cctcatgtct tctctggcat ccatctttaa cagcagtagc acgctcttca ccatggatat 4921 ctacacgcgc ctgcggcccc gtgcaggtga taaggagctg ctgctagttg gaaggtgtgg 4981 cctggctccc accctgctcc attattgacc ctgggatgtg ggcggagcac caggagggta 5041 atggggaagg cggggcttca gtgaaatctg attgtcctca actacaggct ctgggtggta 5101 ttcatcgtgg cggtgtccgt ggcttggctg ccagtggtgc aggcagctca gggtgggcag 5161 ctcttcgatt ac PCR primer binding sites are underlined; sequencing primer binding sites are highlighted. The deleted nucleotides are highlighted in red. | ||||||||||||||||||||||||||||||||||||||||||||||||||||||||||||||||||||||||||||||||||||||||||||||||||||||||||||||||||||||||||||||||||||||||||||||||||||||||||||||||||||||||||||||||||||||||||||||||||||||||||||||||||
| References | |||||||||||||||||||||||||||||||||||||||||||||||||||||||||||||||||||||||||||||||||||||||||||||||||||||||||||||||||||||||||||||||||||||||||||||||||||||||||||||||||||||||||||||||||||||||||||||||||||||||||||||||||||
| Science Writers | Anne Murray | ||||||||||||||||||||||||||||||||||||||||||||||||||||||||||||||||||||||||||||||||||||||||||||||||||||||||||||||||||||||||||||||||||||||||||||||||||||||||||||||||||||||||||||||||||||||||||||||||||||||||||||||||||
| Illustrators | Diantha La Vine | ||||||||||||||||||||||||||||||||||||||||||||||||||||||||||||||||||||||||||||||||||||||||||||||||||||||||||||||||||||||||||||||||||||||||||||||||||||||||||||||||||||||||||||||||||||||||||||||||||||||||||||||||||
| Authors | Wataru Tomisato, Katharina Brandl, Bruce Beutler |
 Phenotypic Mutation
 Figure 1.
 Figure 2. Measurement of water intake in the male (left) and female (right) jimbee mice.
 Figure 3. Male (left graph) and female (right graph) jimbee mice (red squares) are comparably susceptible to DSS by gavage as wild-type cohorts (blue circles).
 Figure 4. Jimbee mice have diluted urine (left graph) and display severe glucosuria (right graph).
 Figure 6. Schematic diagram of the deletion located in the Slc5a2 gene in the jimbee mice. The jimbee mutation results in deletion of 19 bp within exon 10. Black signifies amino acid coding regions. (top) The deleted base pairs are indicated in red within the C57BL/6J sequence. (bottom) This deletion results in a frameshift and a premature stop codon within exon 10. The nucleotides that flanked the deleted nucleotides are in blue.
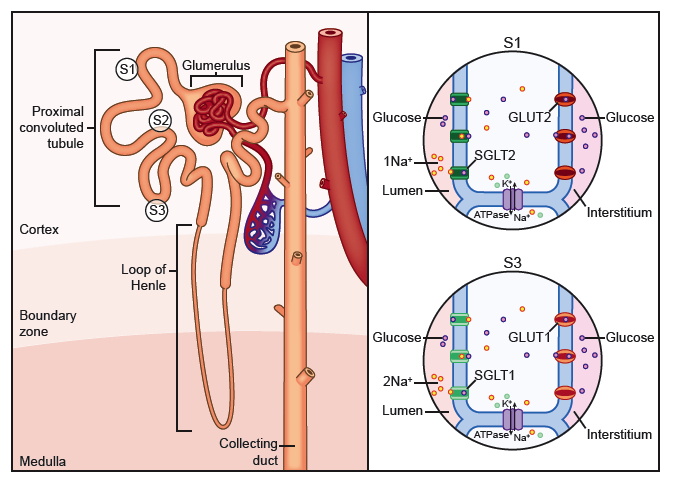 Figure 9. Renal glucose reabsorption in the proximal convoluted tubule. 90% of the ~180 grams of glucose filtered daily in the kidney is reabsorbed in the S1 segment of the proximal tubule via SGLT2 and GLUT2. The remaining (~10%) glucose that does not get reabsorbed in the S1 segment, can be reabsorbed in the S3 segment by SGLT1 and GLUT1.